Process Automation Metrics: How to Measure Real Improvement
Automating a business process is easy to celebrate and hard to evaluate. A workflow goes live, manual steps disappear, and everyone assumes the process got better. But "we automated it" is a statement about effort, not about results. Without metrics, teams cannot tell whether automation reduced cycle time, improved compliance, or simply moved the same delays into a different system.
The stakes are growing. According to APQC's 2026 Process & Performance Management Priorities & Challenges survey, 82% of organizations plan to invest in digital tools over the next 18 months, and process automation ranks among the top investment areas, cited by 55% of respondents. As that spending accelerates, the ability to demonstrate what automation actually changed becomes a competitive skill for process teams, not an optional reporting exercise.
This article covers the metrics that matter most when evaluating process automation, how to apply them across common administrative workflows like reimbursement, procurement and onboarding, and how to structure measurement across the full lifecycle of an automation initiative.
Why process automation needs metrics
Most automation projects are justified by a business case: faster approvals, fewer errors, lower operational cost. Metrics are what connect that promise to reality. They serve three practical purposes.
First, they establish a baseline. If you don't know that expense reimbursements took an average of 9 days before automation, you can't claim the new 3-day average as a win. Second, they expose problems that automation alone doesn't fix. An automated procurement process can still stall for a week waiting on a single approver. Third, they justify continued investment. Transformation leaders need evidence when deciding which process to automate next, and that evidence comes from measured outcomes, not anecdotes.
There is also a subtler reason. Automation changes where work happens, and that shift can hide problems. When a task moves from an inbox to a workflow engine, the delay doesn't announce itself in someone's email anymore. Only instrumentation makes it visible.
Measurement alone is not enough, though. In the same APQC survey, only 13% of organizations reported using KPIs in every decision, while 27% said data informs roughly half of their decisions. Many teams collect numbers that never change behavior. The metrics in this article are worth tracking precisely because each one points to a concrete action: redesign a form, add an approver, adjust a routing rule.
A practical framework: measuring across the automation lifecycle
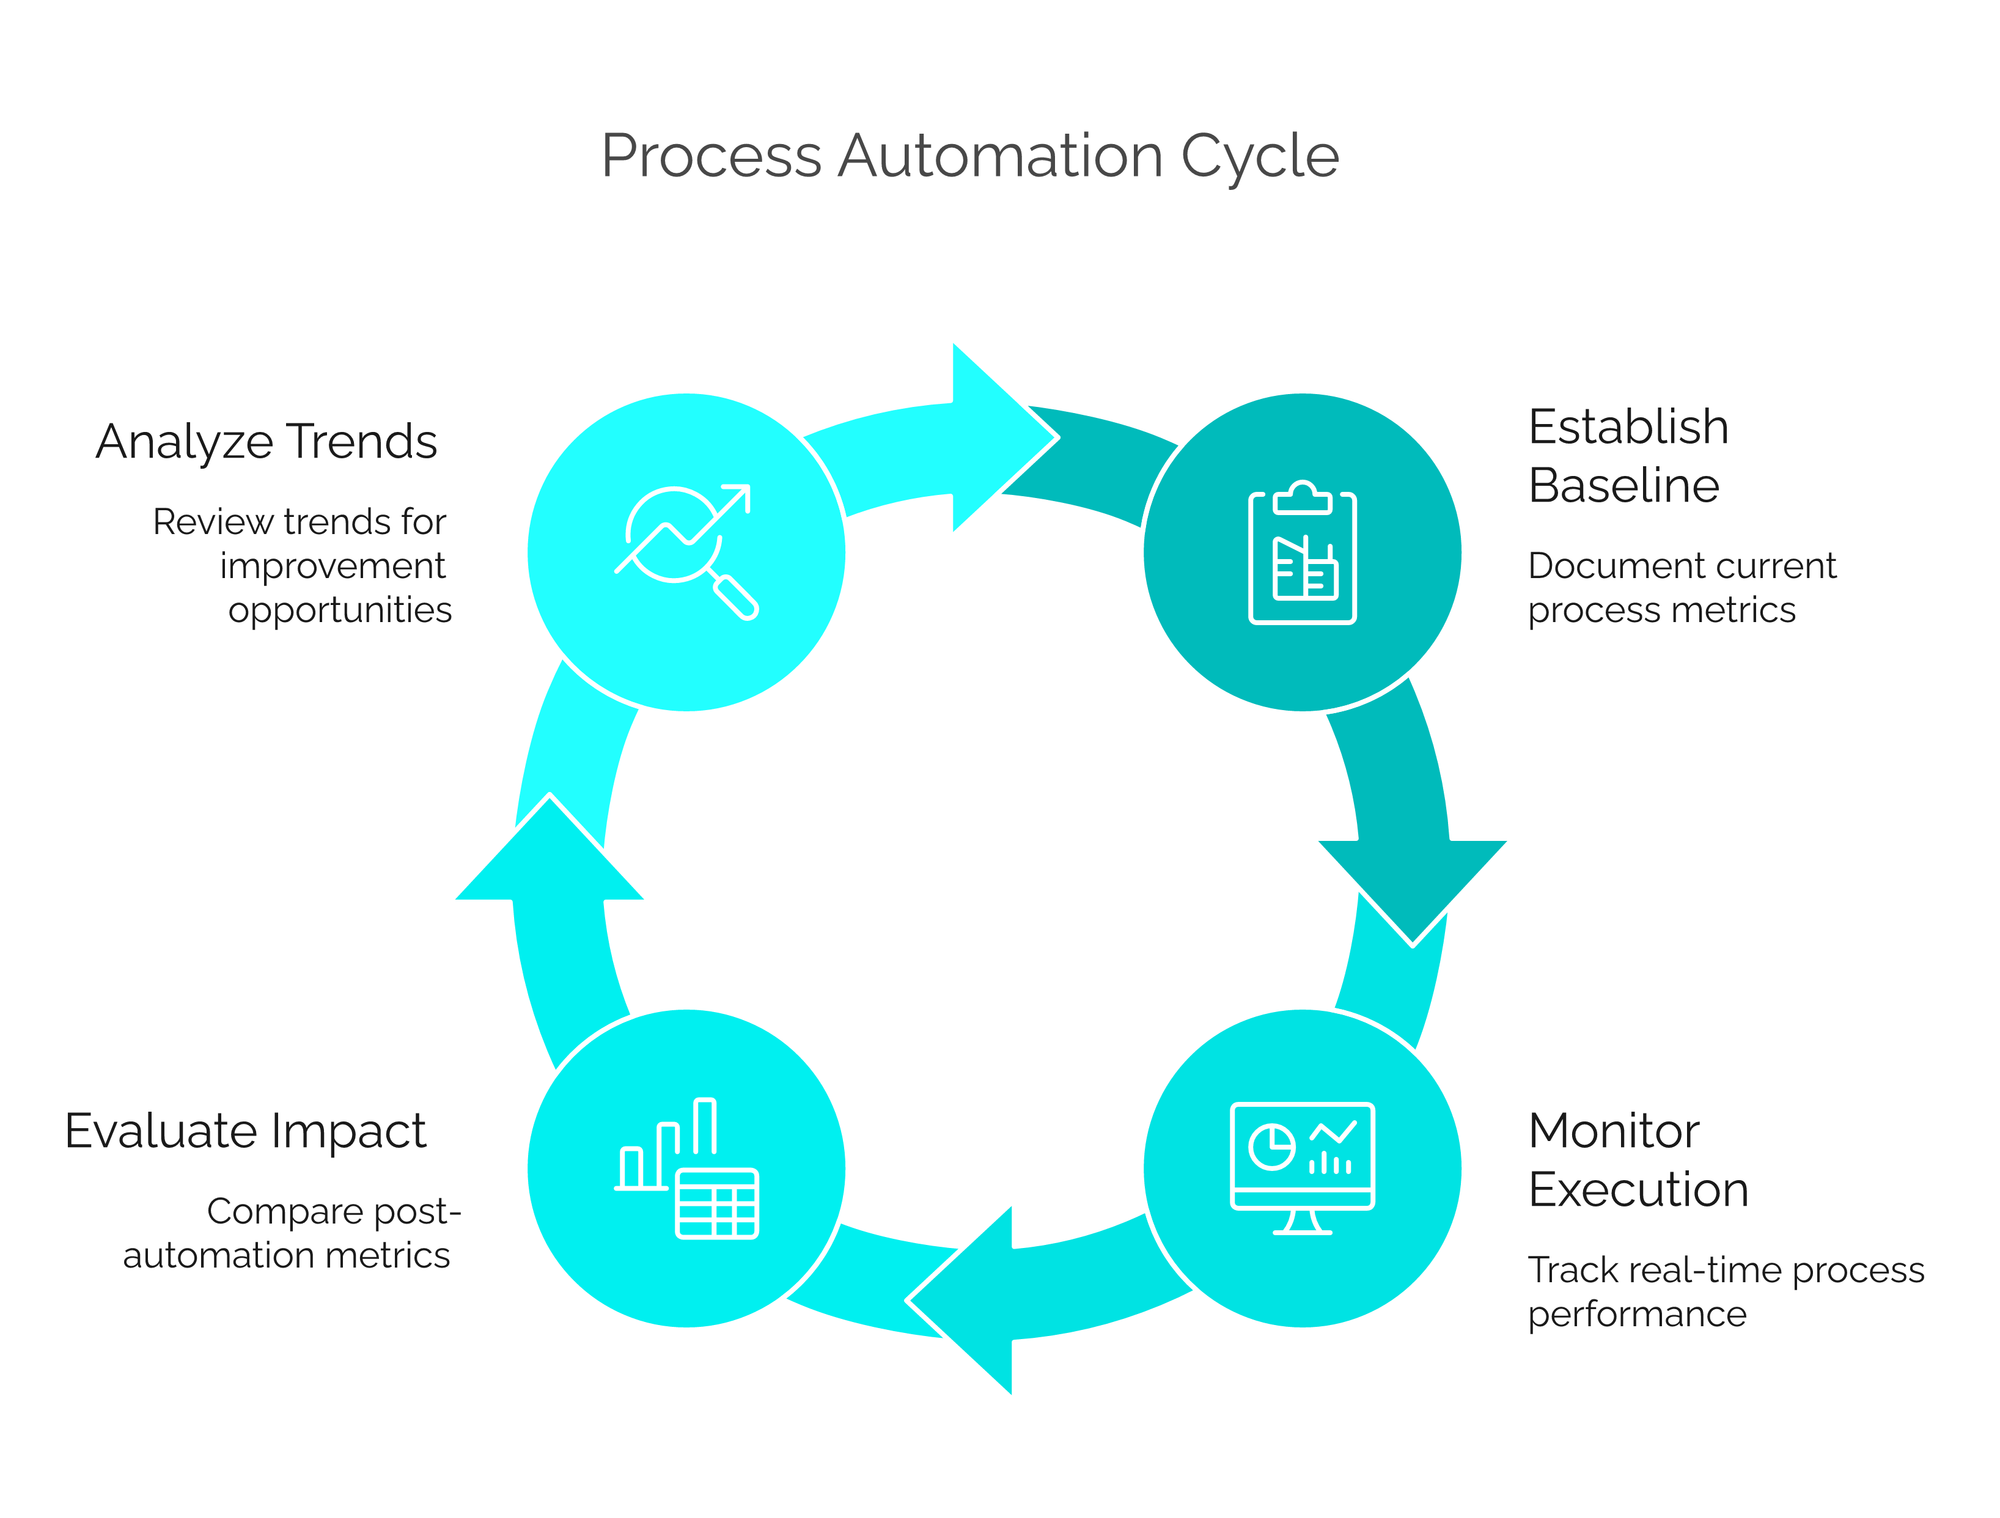
Metrics are most useful when they are tied to a phase of the automation journey. A simple four-stage framework keeps measurement organized:
1. Before automation (baseline). Document how the process performs today: average cycle time, error rates, volume, cost per execution, SLA breaches. If the current process runs on email and spreadsheets, even rough estimates from sampling a few dozen cases are better than nothing. This baseline is the reference point for every claim you make later.
2. During execution (operational monitoring). Once the automated process is live, track it in real time: how many instances are running, where each one is, which tasks are approaching their deadlines, who is responsible for pending work. These operational metrics keep the process healthy day to day.
3. After implementation (impact evaluation). After a stabilization period, typically 60 to 90 days, compare against the baseline. Did cycle time actually drop? Did SLA compliance improve? Did exception volume stay manageable? This is where you validate the business case.
4. Continuous improvement (trend analysis). Processes degrade. Volumes grow, rules change, people find workarounds. Reviewing metric trends quarterly reveals where the process needs redesign, additional automation, or rule adjustments.
With that structure in mind, let's look at the individual metrics.
Cycle time
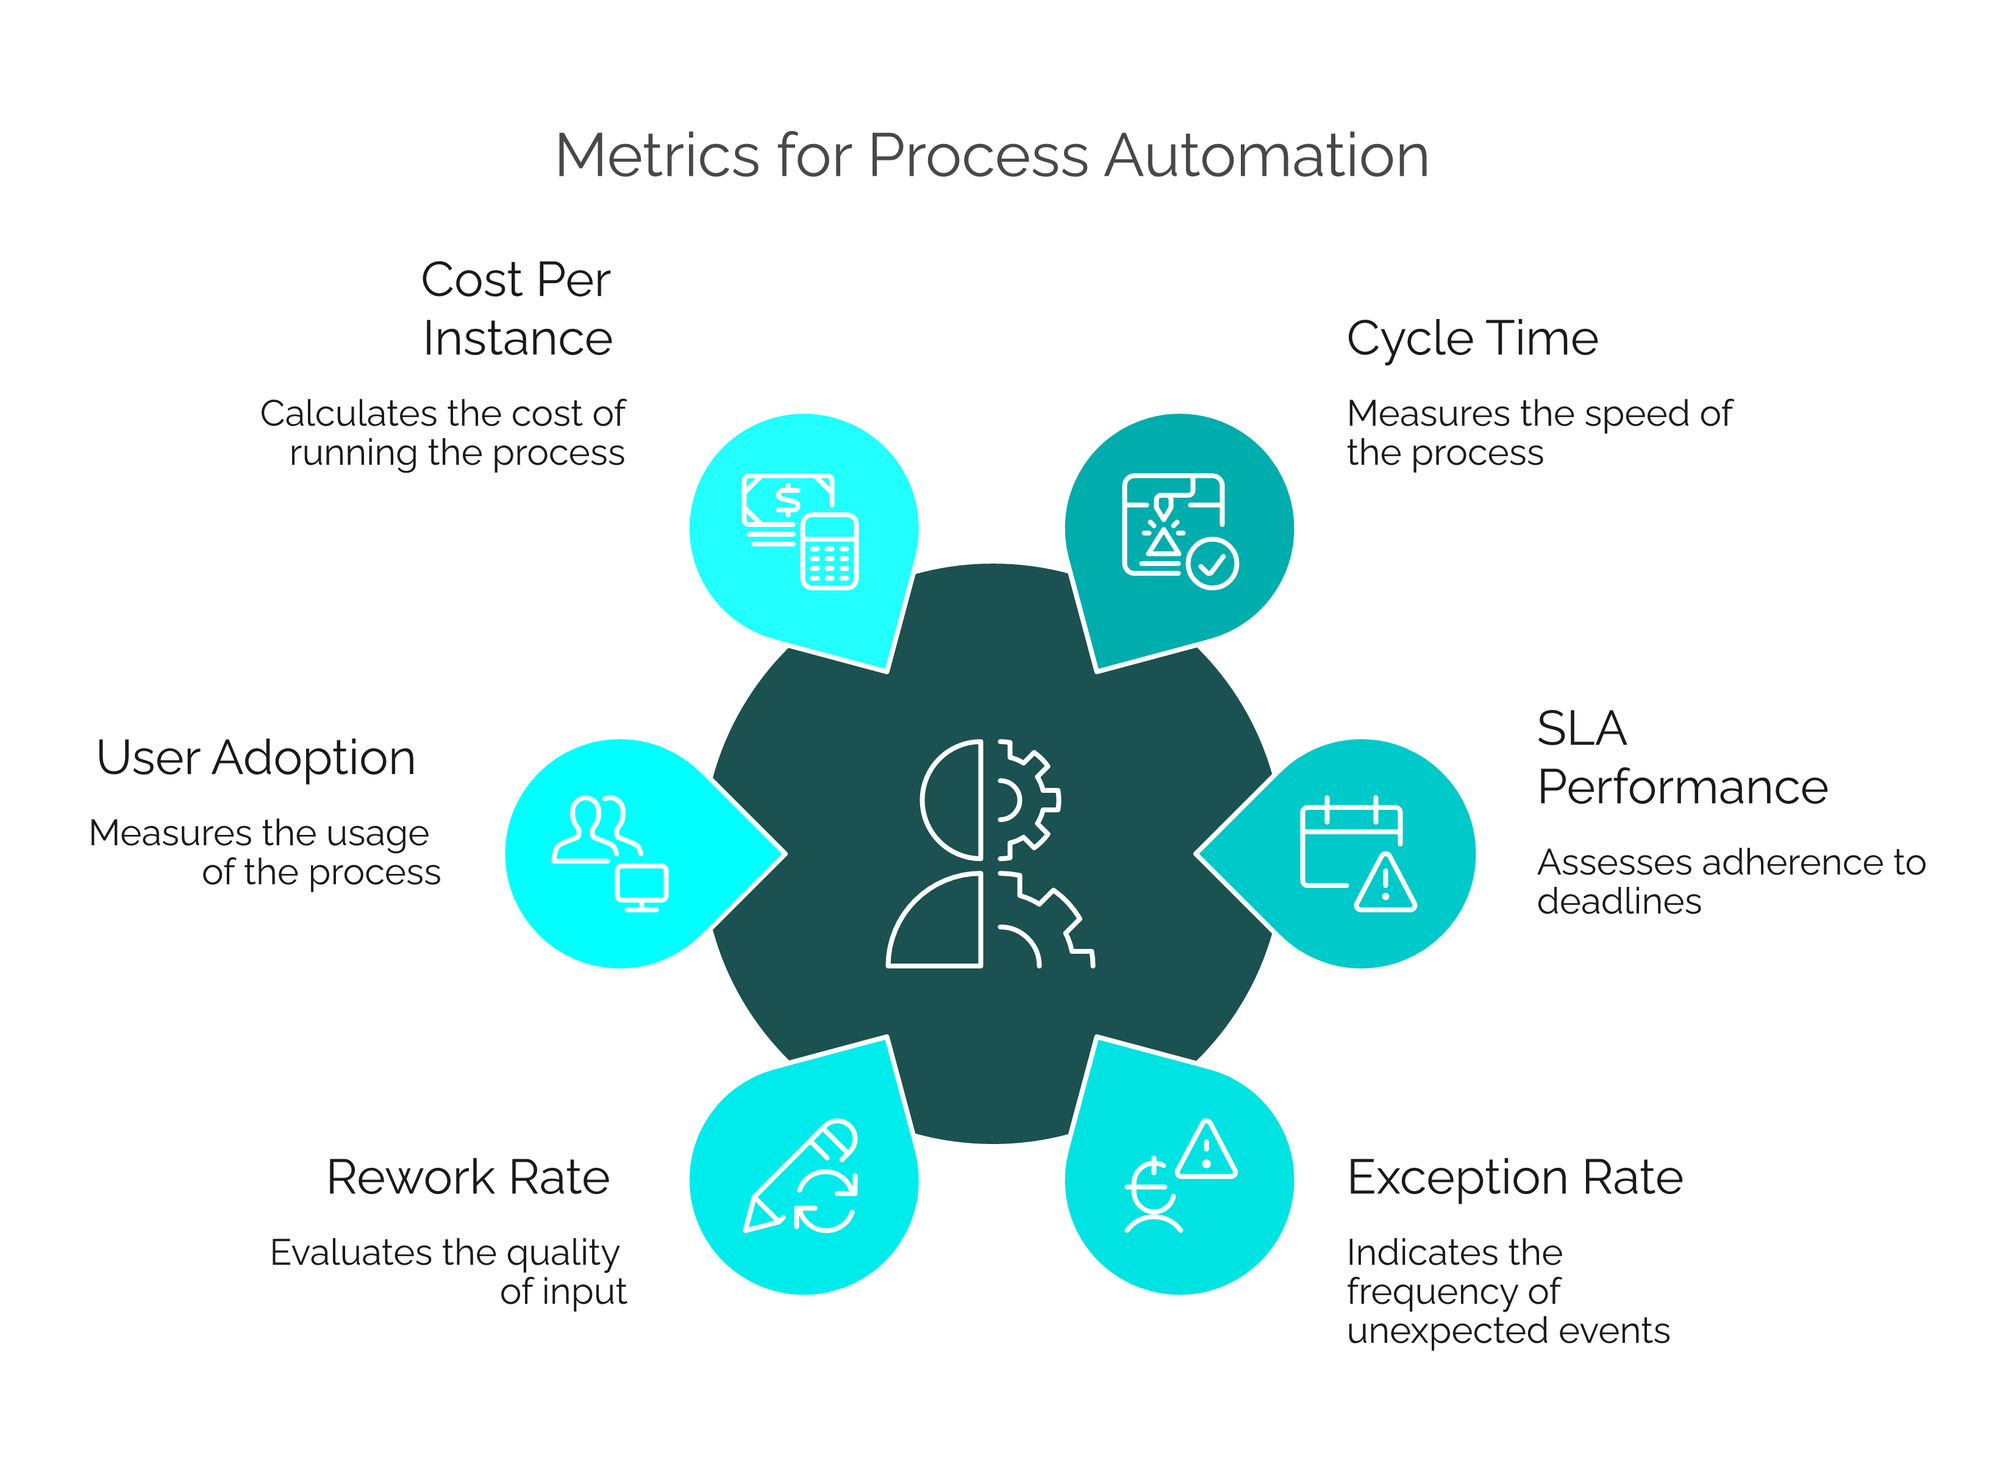
Cycle time measures how long a process instance takes from start to finish. It is the single most cited automation metric because it directly reflects the experience of whoever requested the process: the employee waiting for a reimbursement, the department waiting for a purchase order, the new hire waiting for system access.
Measure both the average and the distribution. An average cycle time of 4 days can hide the fact that 15% of cases take 20 days. Percentiles (P50, P90, P95) tell a more honest story than the mean.
It also helps to break cycle time into segments: time in automated steps versus time waiting on humans. In most administrative workflows, automation compresses the system-side work to minutes, and the remaining cycle time is almost entirely human wait time. Knowing this split tells you where the next improvement opportunity is.
Example: in an employee onboarding process, the automated steps (account provisioning, document generation) may take under an hour, while the manager's equipment approval takes 3 days. The cycle time metric points squarely at the approval step, not at the automation.
SLA performance
SLA performance measures the percentage of process instances completed within an agreed deadline. Unlike raw cycle time, it reflects a commitment: "reimbursements are paid within 10 business days" or "IT access requests are fulfilled in 48 hours."
Track SLA compliance at two levels. Process-level SLA tells you whether the end-to-end promise is being kept. Task-level SLA tells you which individual steps are consuming the available time. A process can meet its overall SLA while one task routinely burns 80% of the budget, leaving no margin when volumes spike.
A related indicator worth watching is the near-miss rate: instances that finished within SLA but with less than, say, 10% of the deadline remaining. A rising near-miss rate is an early warning that breaches are coming.
Bottlenecks
A bottleneck is any step where work accumulates faster than it is processed. In automated processes, bottlenecks almost always sit at human touchpoints: a single approver, a small verification team, a specialist who handles exceptions.
The core measurement is queue time per activity: how long instances wait at each step before someone acts on them. Complement it with queue depth (how many instances are waiting right now) and throughput per participant.
Example: in a procurement process, purchase requests above a threshold route to the finance director. If that one person receives 40 requests a week and reviews them in a Friday batch, every request waits up to 5 days regardless of how fast the rest of the process runs. Queue-time data makes this pattern impossible to ignore and supports concrete fixes: delegation rules, approval thresholds, or backup approvers.
Rework rate
Rework rate measures how often process instances are sent back to a previous step: a reimbursement returned because the receipt is illegible, a purchase request rejected for missing budget codes, an onboarding form bounced back for incomplete data.
High rework is a signal that the process captures poor-quality input, and automation often makes this worse before it makes it better. A digital form that accepts anything will faithfully route garbage to approvers at high speed. Field validation, mandatory attachments and conditional logic at the entry point are the usual remedies, and rework rate is how you verify they worked.
Track rework by step and by reason. "12% of reimbursements are returned" is useful; "9% are returned specifically for missing receipts" is actionable.
Exception rate
Exceptions are instances that leave the standard path: escalations, manual interventions, cases routed to a human because a rule or integration couldn't handle them. Exception rate measures what fraction of your volume the automation actually covers.
Some exceptions are healthy. A well-designed process deliberately routes ambiguous cases to people. The problem is when the exception rate is high enough that the "automated" process is mostly manual, or when it trends upward over time, indicating that business reality has drifted away from the rules encoded in the workflow.
Example: a customer service process auto-classifies incoming requests and routes them to the right team. If 30% of requests end up in a generic "needs manual triage" queue, the classification rules need work, and no cycle-time improvement in the other 70% compensates for the manual load hidden in that queue.
Approval delays
Approvals deserve their own metric because they are the dominant source of delay in administrative workflows. Measure the time between an approval task being assigned and the decision being made, per approver and per approval type.
This data typically reveals patterns that are invisible otherwise: approvers who batch decisions weekly, approvals that stall when a specific person travels, chains where three sequential sign-offs add days without adding scrutiny. Each pattern has a known fix: reminders and escalation rules, delegation during absences, parallel instead of sequential approvals, or removing approval layers below a risk threshold.
A useful derived indicator is approval time as a percentage of total cycle time. When approvals consume 70% of the cycle, further optimizing the automated steps is pointless.
User adoption
An automated process only delivers value if people actually use it. Adoption metrics answer whether they do: the percentage of eligible cases initiated through the automated process versus legacy channels (email, phone, spreadsheets), active user counts, and abandonment rates on forms.
Low adoption is usually a design problem, not a training problem. If employees still email the purchasing team instead of using the portal, the portal is probably harder than email. Watch where users drop off. A form abandoned at the same field by many users is telling you exactly what to fix.
Adoption also matters for measurement integrity: if 40% of requests bypass the system, every other metric describes only the 60% you can see.
Compliance and auditability
For regulated environments and for any organization pursuing certifications, automation's biggest payoff is often traceability rather than speed. Relevant metrics include the percentage of instances with a complete audit trail, segregation-of-duties violations detected, mandatory-step skip attempts, and the time needed to produce evidence for an audit.
That last one is underrated. In a manual process, answering "show me every purchase above 10,000 euros approved in Q2 and who approved it" can take days of digging through emails. In a properly instrumented automated process, it is a query. Measuring evidence-retrieval time before and after automation makes this benefit concrete for compliance and audit teams.
Cost and productivity indicators
Financial metrics translate operational improvement into language the business understands. The most useful ones are:
Cost per process instance: total labor time spent per case multiplied by loaded hourly rates, plus system costs. Compare pre- and post-automation values on the same volume basis.
Hours returned to the team: manual handling time eliminated per case, multiplied by monthly volume. Be honest here. Time saved is only a real gain if it is reallocated to higher-value work; report where those hours went.
Throughput per FTE: how many cases the same team processes per period. This often improves more visibly than headcount cost, because teams typically absorb growth rather than shrink.
Error cost avoidance: for processes where mistakes have direct financial impact (duplicate payments, incorrect reimbursements, contract penalties from missed deadlines), the reduction in error frequency times average error cost.
Avoid claiming savings from time fractions too small to reallocate. Saving 3 minutes per case across 200 cases a month sounds like 10 hours, but if it's spread across 15 people, nobody's job actually changed.
How to choose the right metrics
No team should track everything above. A practical selection method:
Start from the business case. If automation was justified by speed, cycle time and SLA performance are your core metrics. If it was justified by control, prioritize compliance and exception metrics. The metrics should answer the question the investment was supposed to solve.
Pick one metric per stakeholder. Requesters care about cycle time. Operations managers care about queues and SLAs. Finance cares about cost per instance. Compliance cares about audit completeness. Three to five well-chosen metrics with clear owners beat a dashboard of twenty that nobody acts on.
Make sure each metric has a decision attached. Before adopting a metric, ask: if this number gets worse, what will we do? If there is no answer, drop it. Rework rate earns its place because a spike triggers form redesign; a vanity metric like "total instances processed" rarely triggers anything.
Instrument from day one. Retrofitting measurement is painful. Define the metrics before go-live so the workflow captures timestamps, responsibilities and outcomes from the first instance.
How automation platforms make measurement possible
Everything in this article assumes one thing: that process execution data exists and is trustworthy. That assumption fails more often than teams expect. APQC's research found that inadequate data quality and the lack of standardized measures across business groups are the two most common KPI reporting challenges, each cited by 48% of respondents. When metrics are assembled manually from emails, spreadsheets and disconnected systems, both problems are almost guaranteed.
This is where the choice of platform matters. When processes run on a BPM platform like HEFLO, every instance carries its own execution record: when each task started, who it was assigned to, when deadlines approach or expire, where the instance currently stands. Managers can monitor execution status and responsibilities in real time instead of asking around, and deadline tracking turns SLA management from a monthly spreadsheet exercise into an operational habit. The same execution data that runs the process becomes the raw material for every metric discussed here, without a separate measurement project.
Frequently Asked Questions
What are the most important metrics for process automation?
The core set for most teams is cycle time, SLA compliance rate, exception rate, rework rate and cost per process instance. Together they answer whether the process got faster, more reliable, and cheaper, and whether the automation actually covers the real case volume.
How do you measure whether automation actually improved a process?
Establish a baseline before automation (cycle time, error rate, cost per case), let the automated process stabilize for 60 to 90 days, then compare the same indicators on the same volume basis. Improvement claims without a pre-automation baseline are not verifiable.
What is a good cycle time reduction after automating a process?
It depends on how much of the original cycle time was system work versus human wait time. Administrative processes commonly see 40% to 70% cycle time reduction, but the honest benchmark is your own baseline: any statistically consistent reduction that holds across volumes is a real improvement.
What is the difference between cycle time and SLA performance?
Cycle time measures how long instances actually take; SLA performance measures the percentage of instances that finish within a committed deadline. A process can have a good average cycle time and still breach SLAs frequently if its duration varies widely.
How do you identify bottlenecks in an automated process?
Measure queue time per activity: how long instances wait at each step before someone acts. The steps with the longest waits and deepest queues are your bottlenecks, and in automated processes they are almost always human touchpoints such as approvals or manual verifications.
Why is user adoption a process automation metric?
Because an automated process only improves outcomes for the cases that flow through it. If a significant share of requests still arrives by email or phone, the measured improvements apply to a fraction of the real volume, and the remaining metrics overstate the automation's impact.
How often should process automation metrics be reviewed?
Operational metrics (queues, deadlines, pending tasks) should be monitored continuously by process owners. Impact metrics (cycle time trends, SLA rates, cost per instance) work well on a monthly review cycle, with a deeper quarterly analysis to decide on process redesign or new automation candidates.