Solution Evaluation in Business Process Automation

A process automation project can go live on time, on budget, and with every requirement checked off — and still fail to deliver value. Handoffs that were slow before automation may remain slow, only faster to track. Exceptions that used to pile up in inboxes now pile up in queues. The technology works; the business outcome doesn't materialize.
Solution evaluation is the discipline that closes this gap. It answers a question that go-live celebrations tend to skip: is this automation actually making the process better, and how do we know?
What solution evaluation means
Solution evaluation is the structured assessment of whether an implemented (or partially implemented) solution delivers the value it was expected to deliver. In the BABOK® Guide, it is one of the six knowledge areas of business analysis, covering the measurement of solution performance, the analysis of results, and the identification of limitations that prevent full value realization.
Applied to business process automation, solution evaluation means comparing the automated process against the business objectives that justified the investment in the first place. It looks at cycle times, error rates, cost per instance, SLA compliance, and user adoption — and it looks at them continuously, since the value of an automation can erode as volumes, teams, and business rules change.
The key word is value, and that is where many automation initiatives lose their way.
Why delivery is not the same as value
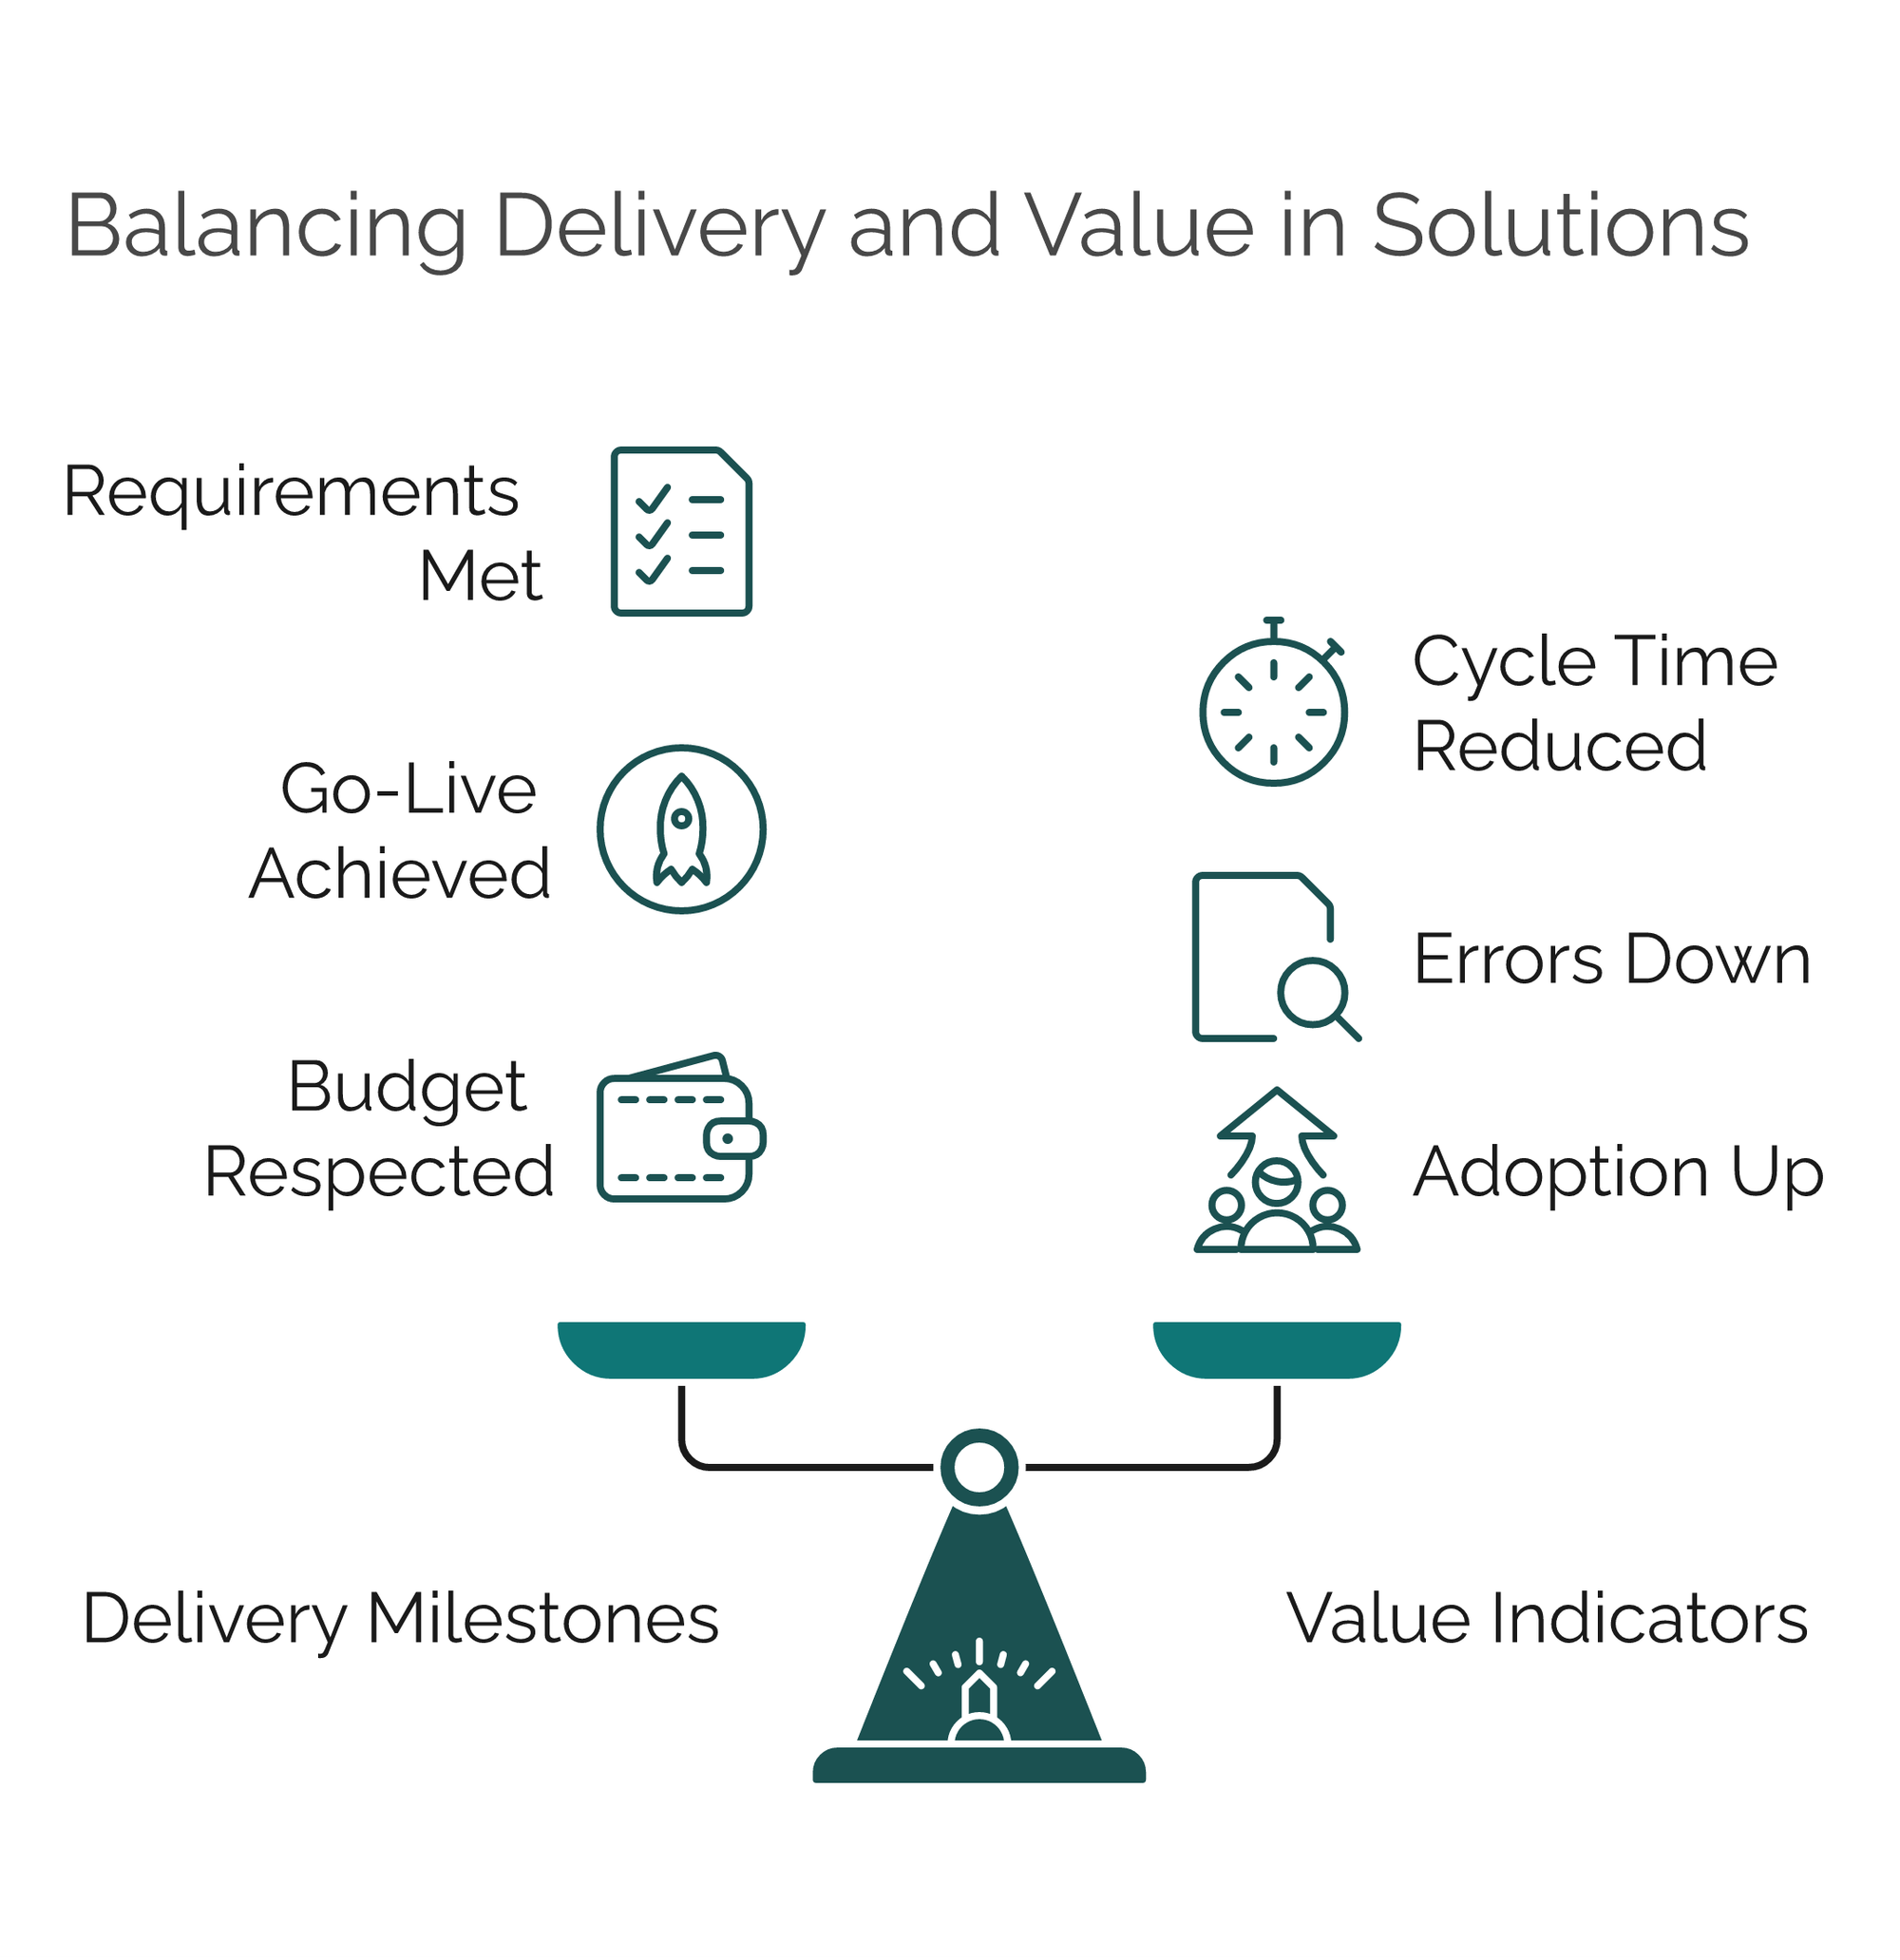
Delivery answers the question "did we build what was specified?" Value answers "did the business improve because of it?" The two can diverge for several reasons:
- The process was automated as-is, inefficiencies included. Automating a broken process gives you a faster broken process. If approvals were redundant before, they are redundant now — just executed more quickly.
- The bottleneck moved instead of disappearing. Automating data entry may shift the constraint to a manual review step downstream, leaving end-to-end cycle time unchanged.
- Users work around the system. If the automated flow is harder to use than email and spreadsheets, people will quietly return to email and spreadsheets, and the process data will stop reflecting reality.
- The baseline was never measured. Without knowing how long the process took before automation, any claim of improvement is a guess.
Solution evaluation forces the conversation back to outcomes. A workflow that executes flawlessly but reduces neither cost nor cycle time nor error rate has been delivered, not realized.
What to evaluate before implementation
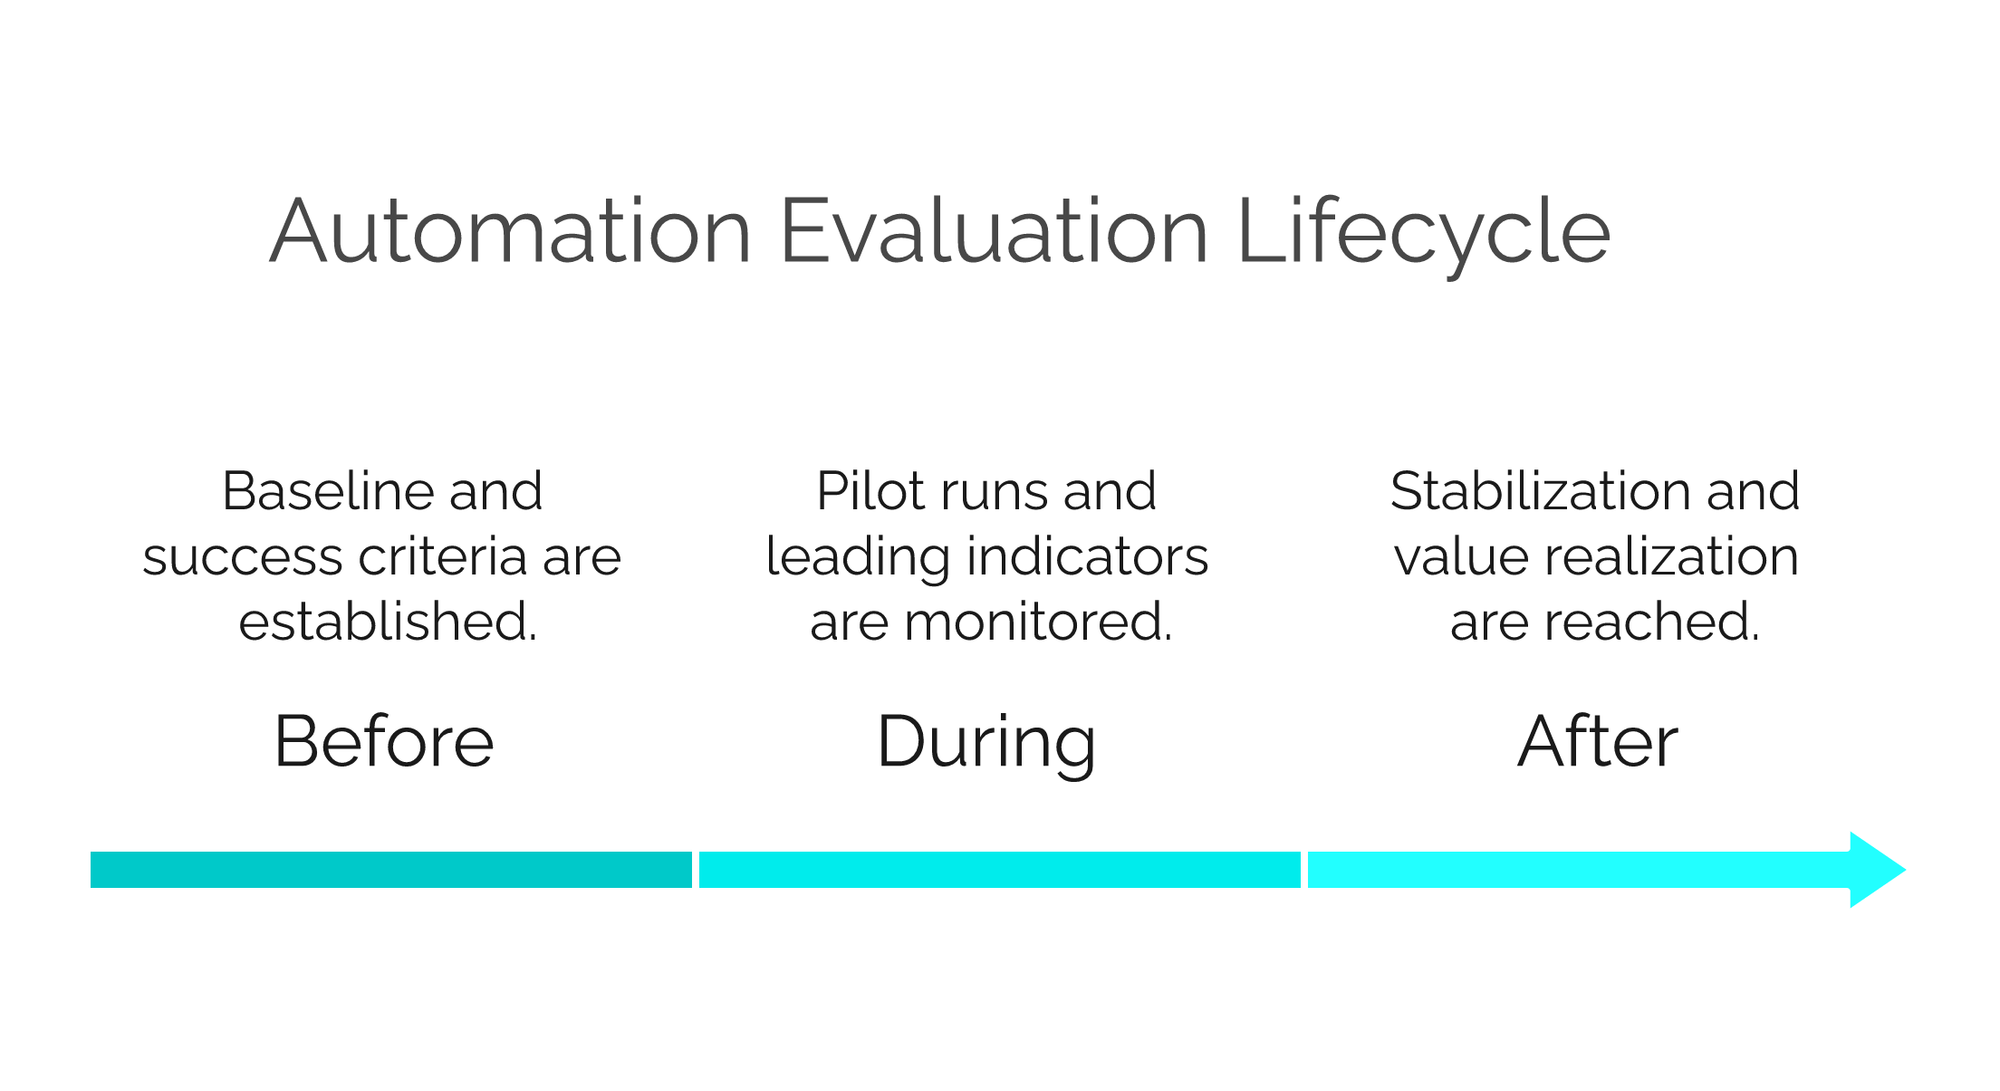
Evaluation starts before a single task is automated. The pre-implementation phase establishes the reference points that make later measurement possible.
Baseline performance. Measure the current process: average and variance of cycle time, volume per period, error and rework rates, cost per execution, and SLA compliance. If the process is informal and unmeasured, even a two-week sampling exercise is better than nothing.
Business objectives and success criteria. Translate the business case into measurable targets. "Improve the purchasing process" is not evaluable; "reduce purchase order cycle time from 6 days to 2 days within one quarter of go-live" is.
Process readiness. Assess whether the process is stable and well-understood enough to automate. High exception rates, undocumented decision rules, or frequent ad-hoc variations are signals that redesign should precede automation.
Solution fit. Evaluate the candidate platform or approach against the process requirements: integration needs, volume, compliance constraints, and the skill profile of the team that will maintain it.
What to evaluate during implementation
During the build and rollout, evaluation shifts to leading indicators — signals that predict whether the automation will deliver value once live.
Pilot results deserve particular attention. Running the automated process with a limited group against real cases reveals gaps in business rules, unhandled exceptions, and usability friction while they are still cheap to fix. Track how many pilot cases complete without manual intervention, how many exceptions were anticipated versus discovered, and how long users take to complete their tasks compared to the old process.
This is also the moment to validate data quality and integration behavior. An automation that depends on master data from an ERP will only be as reliable as that data; catching mismatches during implementation avoids a flood of exceptions in production.
Finally, monitor scope against objectives. Requirements pressure during implementation tends to add features and postpone the ones tied to measurable outcomes. If the change requests accumulating in the backlog do not trace back to the success criteria, the project may be drifting from value toward delivery.
What to evaluate after implementation
Post-implementation evaluation is where solution evaluation earns its name. It typically unfolds in two horizons.
Stabilization (first 30–90 days). The goal is to confirm the automation works under real volume. Watch for error spikes, exception queues growing faster than they are resolved, workarounds emerging, and support tickets clustering around specific steps. Compare early performance against the pilot to detect regressions.
Value realization (ongoing). Once stable, compare performance against the pre-implementation baseline and the success criteria. Has cycle time actually dropped? Are fewer people needed per thousand instances? Did SLA compliance improve? Is the error rate lower — or did errors simply become invisible because no one reviews the automated steps anymore?
This phase should produce a formal assessment: which objectives were met, which were not, and what limits value realization. The output feeds either a continuous improvement backlog or, in some cases, a decision to redesign or retire parts of the automation.
Metrics for process automation
Effective evaluation depends on a small set of metrics tracked consistently, rather than a large set tracked occasionally. The table below maps common evaluation areas to example metrics and what each one actually tells you.
| Evaluation area | Example metric | What it reveals |
|---|---|---|
| Speed | End-to-end cycle time (median and 90th percentile) | Whether the process is genuinely faster, including outliers that averages hide |
| Efficiency | Cost per process instance | Whether automation reduced the resources consumed per execution |
| Quality | Rework rate (instances returned to a previous step) | Whether errors are being prevented or just processed faster |
| Reliability | SLA compliance rate per step | Which activities and teams consistently miss deadlines |
| Throughput | Instances completed per period vs. instances started | Whether the process keeps up with demand or accumulates backlog |
| Exception handling | Exception rate and mean time to resolve exceptions | How often the "happy path" fails and how expensive failures are |
| Adoption | Active users vs. licensed/expected users; tasks completed in-system | Whether people actually use the automation or bypass it |
| Automation depth | Straight-through processing rate (instances with zero manual touch) | How much of the promised automation is really happening |
Two practices make these metrics trustworthy. First, measure at the instance level, not the aggregate level — averages conceal the 10% of cases that take five times longer and generate most of the complaints. Second, keep the baseline visible: every dashboard should show "before automation" alongside "now."
User adoption and stakeholder feedback
Metrics describe what is happening; users explain why. Low adoption is rarely laziness — it usually points to a concrete friction: a form that asks for information users don't have, a mobile experience that doesn't exist for field teams, or an approval step that arrives without enough context to decide.
Combine quantitative adoption data (login frequency, task completion inside the system, time-to-action on assigned tasks) with structured feedback. Short, recurring check-ins with the people who execute the process surface problems months before they show up in KPIs. Stakeholder interviews with process owners and managers reveal whether the reports and visibility the automation promised are actually being used for decisions.
A useful early-warning signal: watch for shadow processes. When status updates start circulating by email or spreadsheet again, the automated process has lost its position as the source of truth, and the evaluation data itself becomes unreliable.
Bottlenecks, rework, SLA performance and exceptions
Four operational patterns deserve dedicated analysis because they concentrate most of the lost value in automated processes.
Bottlenecks. Look at queue length and waiting time per activity, not just execution time. An approval task that takes two minutes to perform but waits three days in someone's queue is a three-day step. Automation often exposes bottlenecks that were invisible before — which is uncomfortable, and valuable.
Rework. Every instance sent back to a previous step is a defect signal. Track which steps generate returns and why: unclear instructions, missing data at an earlier stage, or business rules that don't match how decisions are really made. Rework rates that stay flat after automation indicate the process design, not the execution, is the problem.
SLA performance. Measure compliance per step and per responsible role, and distinguish between SLAs missed because of workload and SLAs missed because tasks sat unnoticed. The second category is usually solvable with escalation rules and better task visibility; the first requires capacity decisions.
Exceptions. A rising exception rate is the most common way automations quietly decay. New suppliers, new product lines, or changed regulations create cases the original rules don't cover, and each one falls to manual handling. Reviewing exception categories monthly — and promoting frequent exceptions into first-class process paths — keeps the straight-through processing rate from eroding.
Continuous improvement after automation
Solution evaluation is not a one-time audit; it is the sensing mechanism of a continuous improvement loop. A practical cadence looks like this:
- Monitor continuously. Cycle times, SLAs, exceptions, and adoption tracked on live dashboards, with alerts for deviations.
- Review periodically. A monthly or quarterly process performance review where owners examine trends against targets and the pre-automation baseline.
- Prioritize improvements. Findings become a ranked backlog: rule adjustments, form simplifications, new escalation policies, additional automation of manual steps.
- Implement and re-measure. Each change gets its own before/after comparison, so the team learns which interventions actually move the numbers.
Over time, this loop shifts the question from "did the automation work?" to "what should this process become next?" — which is where automation programs generate compounding returns instead of one-off gains.
This is also where the tooling matters. Process automation platforms such as HEFLO make the evaluation loop practical by capturing execution data as a by-product of running the process: every task, deadline, responsible party, and handoff is recorded automatically. Instead of reconstructing performance from logs and spreadsheets, teams can monitor SLA compliance per activity, see who is accountable for each pending task, identify where instances accumulate, and track performance indicators against targets — turning solution evaluation from a periodic project into a standing capability.
Frequently Asked Questions
What is solution evaluation in business process automation?
Solution evaluation is the structured assessment of whether an automated process delivers the business value that justified its implementation. It compares actual performance — cycle time, cost, quality, SLA compliance, adoption — against a pre-automation baseline and defined success criteria, before, during, and after implementation.
When should solution evaluation start?
Before implementation. The baseline measurement of the current process and the definition of measurable success criteria are prerequisites for any meaningful post-implementation evaluation. Without them, there is no reference point to compare against.
Which metrics matter most when evaluating process automation?
End-to-end cycle time, cost per instance, rework rate, SLA compliance per step, exception rate, and straight-through processing rate. Adoption metrics such as active users and tasks completed in-system matter as much as performance metrics, because low adoption invalidates the rest of the data.
Why do automation projects deliver on time but fail to create value?
Common causes include automating an inefficient process as-is, shifting a bottleneck instead of removing it, low user adoption leading to workarounds, and the absence of a measured baseline, which makes improvement impossible to demonstrate or manage.
How is solution evaluation related to the BABOK® Guide?
Solution Evaluation is one of the six knowledge areas in the BABOK® Guide. It covers measuring solution performance, analyzing the results, assessing limitations in the solution and in the enterprise, and recommending actions to increase value — all directly applicable to process automation initiatives.
How often should an automated process be re-evaluated?
Continuously through live monitoring, with formal reviews monthly or quarterly. Automations decay as volumes, rules, and organizations change; rising exception rates and falling straight-through processing are typical signs that a re-evaluation is due.