The Meaning of 23 Flowchart Symbols

Flowchart symbols represent each step of a process and make it easy to understand how it works. Each shape has a specific meaning, from start and process to decisions and data.
In this guide, you’ll learn the meaning of the most important flowchart symbols with clear, practical examples, so you can read and create flowcharts with confidence.
Flowcharts have been used since 1921 and remain an essential tool for visualizing and improving processes.
Meaning of the main flowchart symbols
- Arrow: direction of the process flow
- Start / End: beginning or end of the process
- Process: action or task within the flow
- Decision: choice between paths (yes/no)
- Data: input or output of information
- Document: represents a document
- Database: data storage
These are the most common and essential flowchart symbols.
Next, we explain each symbol in more detail with practical examples.
Meanings of flow chart process mapping symbols
Arrow
The first symbol to be displayed is the arrow, a connection symbol used to indicate a link between two other symbols and the direction of flow.
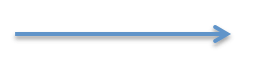
Arrows in flowcharts play a crucial role—they show the direction of flow, guiding the reader through the process from one step to the next. Think of them as the “connective tissue” between different symbols or actions. Without arrows, a flowchart would just be a collection of boxes with no clear sequence.
Termination

Termination refers to the start or end of a process. It's represented by a special symbol: an oval (or sometimes a rounded rectangle), often labeled with words like "Start", "End", or "Exit".
Process

A process represents a specific task, action, or operation that needs to be performed. It's one of the most common elements in flowcharts and is typically shown as a rectangle.
In short, process symbols are the "workhorse" of a flowchart. They map out what actually gets done in each step, helping make complex workflows easy to understand and analyze.
Decision

A decision represents a point where a choice must be made—typically a yes/no or true/false question. It's symbolized by a diamond shape.
In essence, decision points are what make flowcharts dynamic. They add logic and allow for alternative paths, making it easy to model real-world processes that depend on conditions or rules.
Delay

The Delay symbol represents a pause or waiting period in a process. It's used when the workflow must stop temporarily—either to wait for a condition to be met, a timer to expire, or an external action to complete. The symbol looks like a “D”-shaped semicircle, with the flat side on the left.
Examples of Delay symbol:
- “Wait for user input”
- “Pause 10 seconds”
- “Hold until approval received”
It is commonly used in automated systems, user workflows, or any process that isn’t instant.
Data

The Data symbol is used to represent information being stored or retrieved, typically from a file, database, or another storage medium. It’s usually drawn as a slanted rectangle (a parallelogram) or a cylinder if referring specifically to a database.
There are a few variations:
- Input/Output Data (parallelogram) – Often overlaps with the I/O symbol and shows data coming in or going out.
- Stored Data (open-ended rectangle, aka "data storage") – Represents data at rest, like a file or document.
- Database (cylinder) – Specifically used to show storage in a structured database.
The Data symbol brings context to what information is being handled in the process. It helps viewers understand where data lives, how it's used, and when it's moved, which is especially useful in software, business workflows, or data pipelines.
Document

The Document symbol represents a single document generated, received, or used in a process. It looks like a rectangle with a wavy (curved) bottom edge, resembling a piece of paper.
This flowchart symbol is especially useful in business processes, legal workflows, or systems where paperwork (digital or physical) plays a role. It helps clarify what documents are involved at which steps, making your flowchart more complete and informative.
Various documents

It indicates that there are several documents. Actually, it is a special case of the element Document.
Subroutine or default process

The Subroutine symbol represents a named process or function that is defined elsewhere—like a reusable task or a called procedure. It’s shown as a rectangle with double vertical bars on each side.
This symbol helps break down complex workflows into manageable pieces. It’s perfect for large systems, where certain steps are best handled in their own separate flowchart but need to be referenced from the main one. It keeps your diagrams tidy and easy to follow.
Preparation

The Preparation symbol represents a setup or initialization step—something that must be done before the main process can begin or continue. It’s drawn as a hexagon, sometimes referred to as a “setup” symbol.
The flowchart Preparation symbol helps clarify that a specific setup is needed before the workflow can proceed. It makes your flowchart more precise, especially when showing technical processes or anything with a clear initialization phase.
Display

The Display symbol represents information being shown to the user—usually on a screen or monitor. It’s used when the process involves outputting data for viewing rather than for further processing. The symbol looks like a rectangle with a curved (concave) top edge, resembling a computer display.
The symbol makes it clear that something is meant to be seen by a user. It adds another layer of detail to the flowchart, helping illustrate how the system communicates results or statuses visually.
Manual entry

The Manual Entry symbol represents a step where a user manually inputs data into the system, such as typing on a keyboard or filling out a form. It’s drawn as a rectangle with a slanted top edge (sloping upward from left to right).
This flowchart symbol helps distinguish between automated system steps and those that depend on a human operator. It’s especially important for identifying bottlenecks, potential errors, or steps that could be automated in process improvement initiatives.
Loop manual

The Manual Loop symbol represents a repetitive process that is performed manually until a certain condition is met. It’s typically shown as a hexagon with two inward-facing notches on the left and right sides (kind of like a stretched-out "H").
This flowchart symbol helps clarify when repetition isn’t automated—it depends on human intervention. This is especially helpful in operations or quality control processes, making it easy to identify areas where labor-intensive loops may occur.
Loop Limit

The Loop Limit symbol represents the end point or boundary of a loop—it defines how many times a loop should be executed or when it should stop. It’s used to control repetition in a process and is especially relevant in technical or programming flowcharts. The symbol is a hexagon, similar in shape to the Preparation symbol, but used specifically to signal the loop's condition or boundary.
The Loop Limit symbol is crucial for showing where a repeated action stops. It helps visualize controlled repetition, giving clarity to how long a loop runs—whether it’s based on a counter, a condition, or a completion state.
Stored Data

The Stored Data symbol represents information that is saved for later use, such as files, documents, logs, or database entries. It’s shown as an open-ended rectangle (like a rectangle with the right side curved inward), often referred to as the data storage or data file symbol.
This flowchart symbol helps clarify where information is kept or retrieved from, especially in processes that involve documentation, records, or persistent storage. It’s a key element in showing how data flows across systems and how it’s managed over time.
Connector

The Connector symbol is used to link different parts of a flowchart, especially when the diagram is too large to fit on one page or when lines would otherwise cross and make the chart messy. It’s represented by a small circle with a label inside.
Connectors keep your flowcharts clean, readable, and well-organized. They’re essential when dealing with large or multi-page diagrams, helping users follow the flow without getting lost in a maze of arrows.
Connector to another page

The Off-Page Connector symbol is used to show that the flow continues on a different page or section of the flowchart. It’s shaped like a pentagon (sometimes called a "home plate" shape) and usually contains a label or reference ID to help match it with the corresponding symbol on the other page.
This flowchart symbol is essential for navigating big flowcharts. It helps users seamlessly jump between parts of a process without confusion, keeping the visual logic clean and organized—even across multiple pages.
Summing Junction

The Summing Junction symbol is used when multiple process paths must converge into a single flow, typically after being executed in parallel or as independent branches. It indicates that all incoming paths need to complete before the next step in the process can proceed. The symbol is drawn as a circle divided into four equal quadrants, giving it a distinct, symmetrical appearance.
This flowchart symbol is useful when you're modeling synchronized processes, where every path must be completed before the flow can move forward. While not part of the official ANSI/ISO flowchart symbols, it’s widely used in systems engineering, control flow diagrams, and custom process modeling to represent convergence logic clearly and effectively.
And

The AND symbol is used when a process requires that multiple conditions or inputs must all be true or complete before proceeding. It represents convergent logic, where all incoming branches need to be satisfied simultaneously. The symbol is drawn as a circle divided into four sections diagonally, forming an "X" pattern inside a circle.
This symbol is essential when you're modeling strict logic dependencies within a process. It ensures that every required path has been completed before moving forward. While not part of the basic ANSI/ISO flowchart symbol set, it's widely used in engineering, logic design, and complex business process modeling for clarity in converging logic.
Collate (or Merge)

The Collate (or Merge) symbol is used when two or more inputs are brought together to be organized, matched, or compared before moving to the next step. It indicates that items from separate sources are combined in a structured way. The symbol is drawn as an hourglass shape—two triangles touching tip to tip.
This symbol helps clarify when the process involves organizing, aligning, or merging multiple items. While not as common in basic flowcharts, it appears frequently in document-heavy, logistics, or system integration workflows to show when order and grouping matter.
Sort

The Sort symbol is used when a process step involves arranging items in a specific order, such as alphabetically, numerically, or by priority. It represents the sorting of data or documents to prepare for the next step in the workflow. The symbol is drawn as a vertical diamond (like a rotated square) with a horizontal line through the middle.
This symbol is helpful in workflows that require structured output or sequencing. It adds clarity when a process must organize or prepare data for further analysis, processing, or output.
Merge

The Storage symbol is used when a process involves storing data or documents in a physical or offline location, such as filing cabinets, archives, or other non-digital storage systems. The symbol is drawn as a solid triangle pointing downward.
Finally, this flowchart symbol is helpful for modeling workflows that involve long-term or physical retention of information. It’s particularly valuable in industries like healthcare, legal, or finance, where record-keeping and archiving play a critical role.
Database
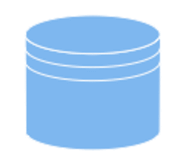
The Database symbol is used to represent structured data storage, typically in a relational database or another digital data repository. It indicates where information is stored and can be retrieved or updated during the process. The symbol is drawn as a cylinder, resembling a traditional database stack.
This flowchart symbol is vital when modeling digital systems that interact with stored data. It provides a clear visual cue that the process step involves persistent, structured, and queryable data storage, making it a key component in modern flowcharts and system diagrams.
Internal Storage

The Internal Storage symbol represents data held within the process or system's internal memory—often temporary, and not saved to an external database or file. It’s used to indicate data that is stored locally, typically during runtime. The symbol is drawn as a rectangle with a wavy (concave) cut on the left side.
This flowchart symbol is useful when modeling workflows that involve non-persistent, local data handling. It distinguishes between data saved for the long term (like in a database) and data held just long enough to complete the current task or session.
Next, we are going to present some examples of flowchart diagrams.
Examples of Flowcharts
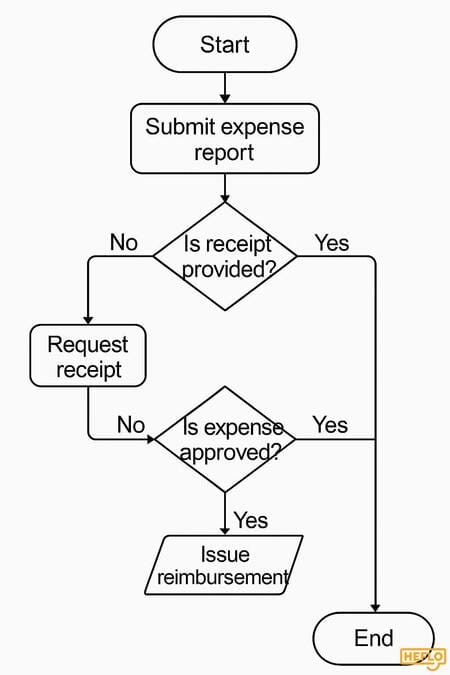
Example 1 - Reimbursement of Expenses
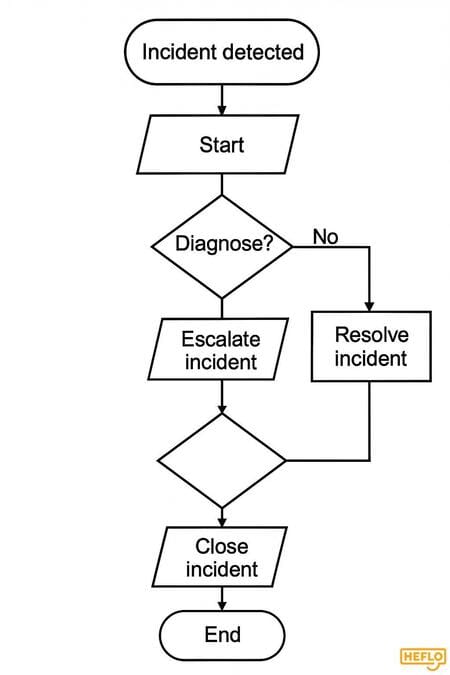
Example 2 - ITIL Incident
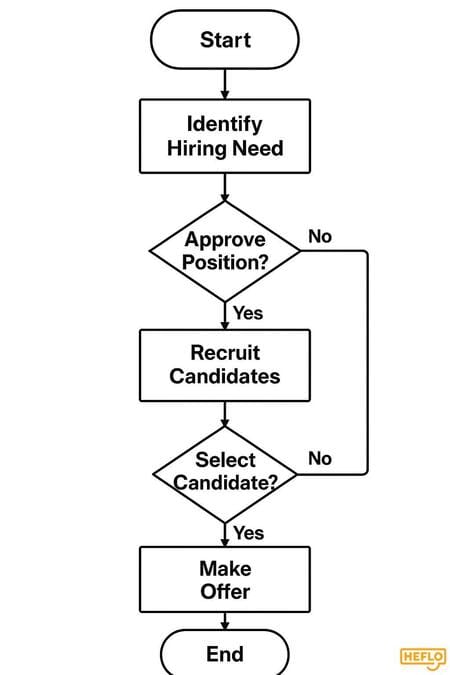
Example 3 - HR Hiring
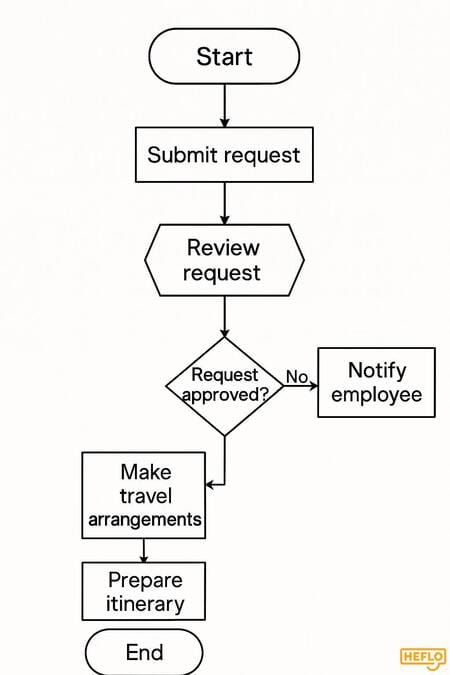
Example 4 - Travel Request
Have you heard of BPMN?
BPMN (Business Process Model and Notation) is the most modern and widely used standard for modeling business processes. It offers a clear and intuitive graphical notation that helps both business and technical teams understand, design, and improve processes. If you're new to BPMN or want to see it in action, watch our video tutorial where we show step-by-step how to create a business process using this powerful notation.
👉 If you’ve made it this far, you deserve a special bonus: access 10 BPMN process examples to download, edit, and apply to boost your organization’s efficiency.